Curve appears cut due to video camera FPS limitations. Real life demonstrations show continuous curves.
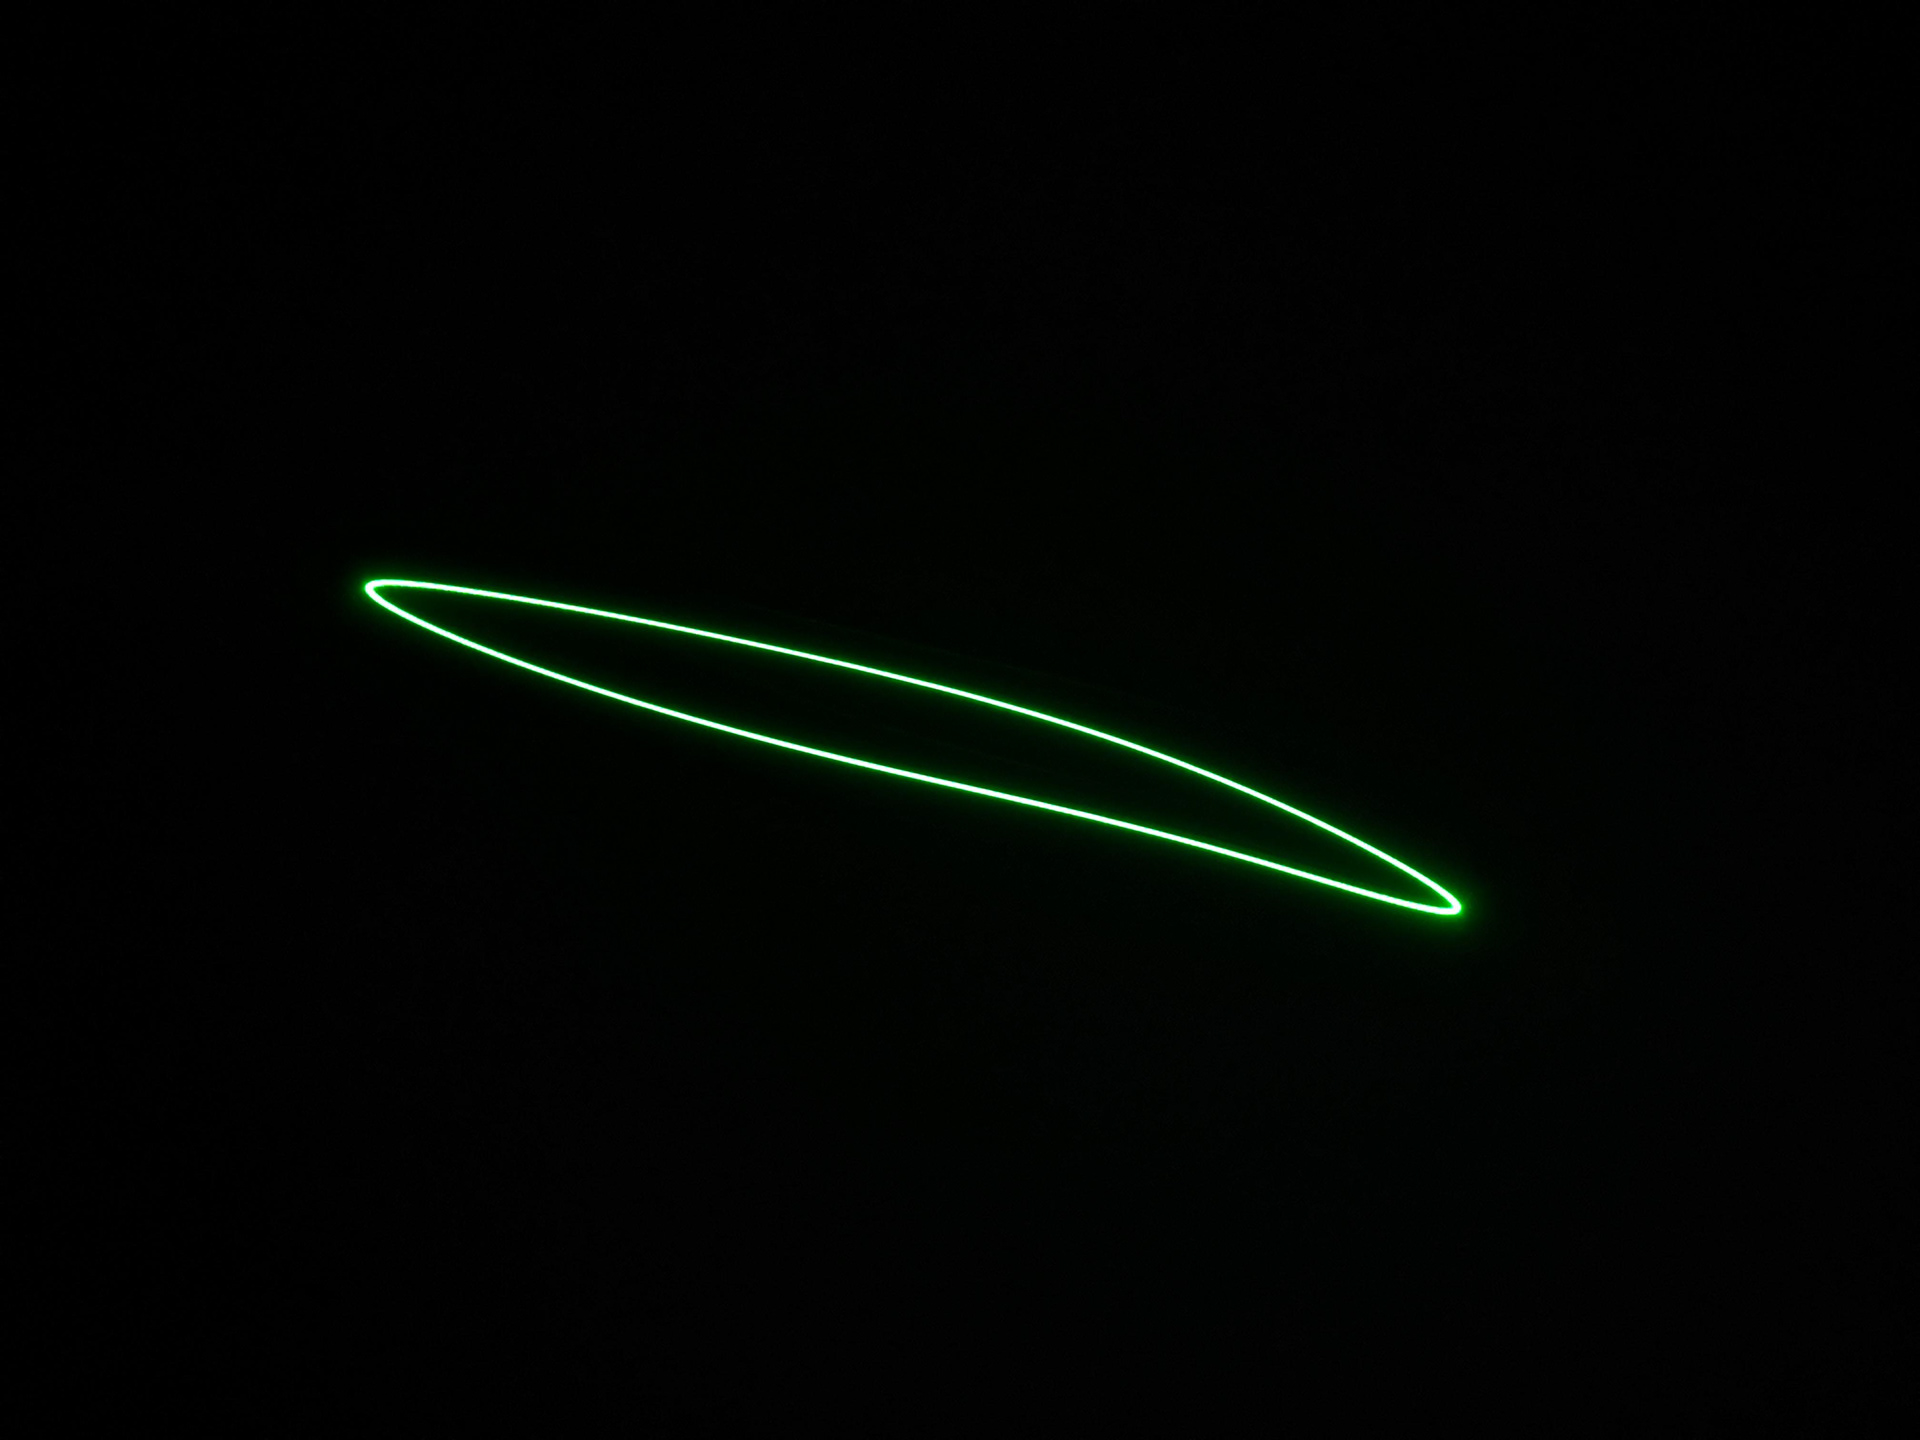
156 Hz static curve.
Sound Visualized works off a simple concept in which sound vibrations are captured and displayed through lasers and mirrors that are subject to a speaker. This phenomenon was tried and iterated to understand the main parameters that alter the output curves and subsequently develop a platform that would allow the continued reproduction and experimentation of the phenomena.
watch the videos below
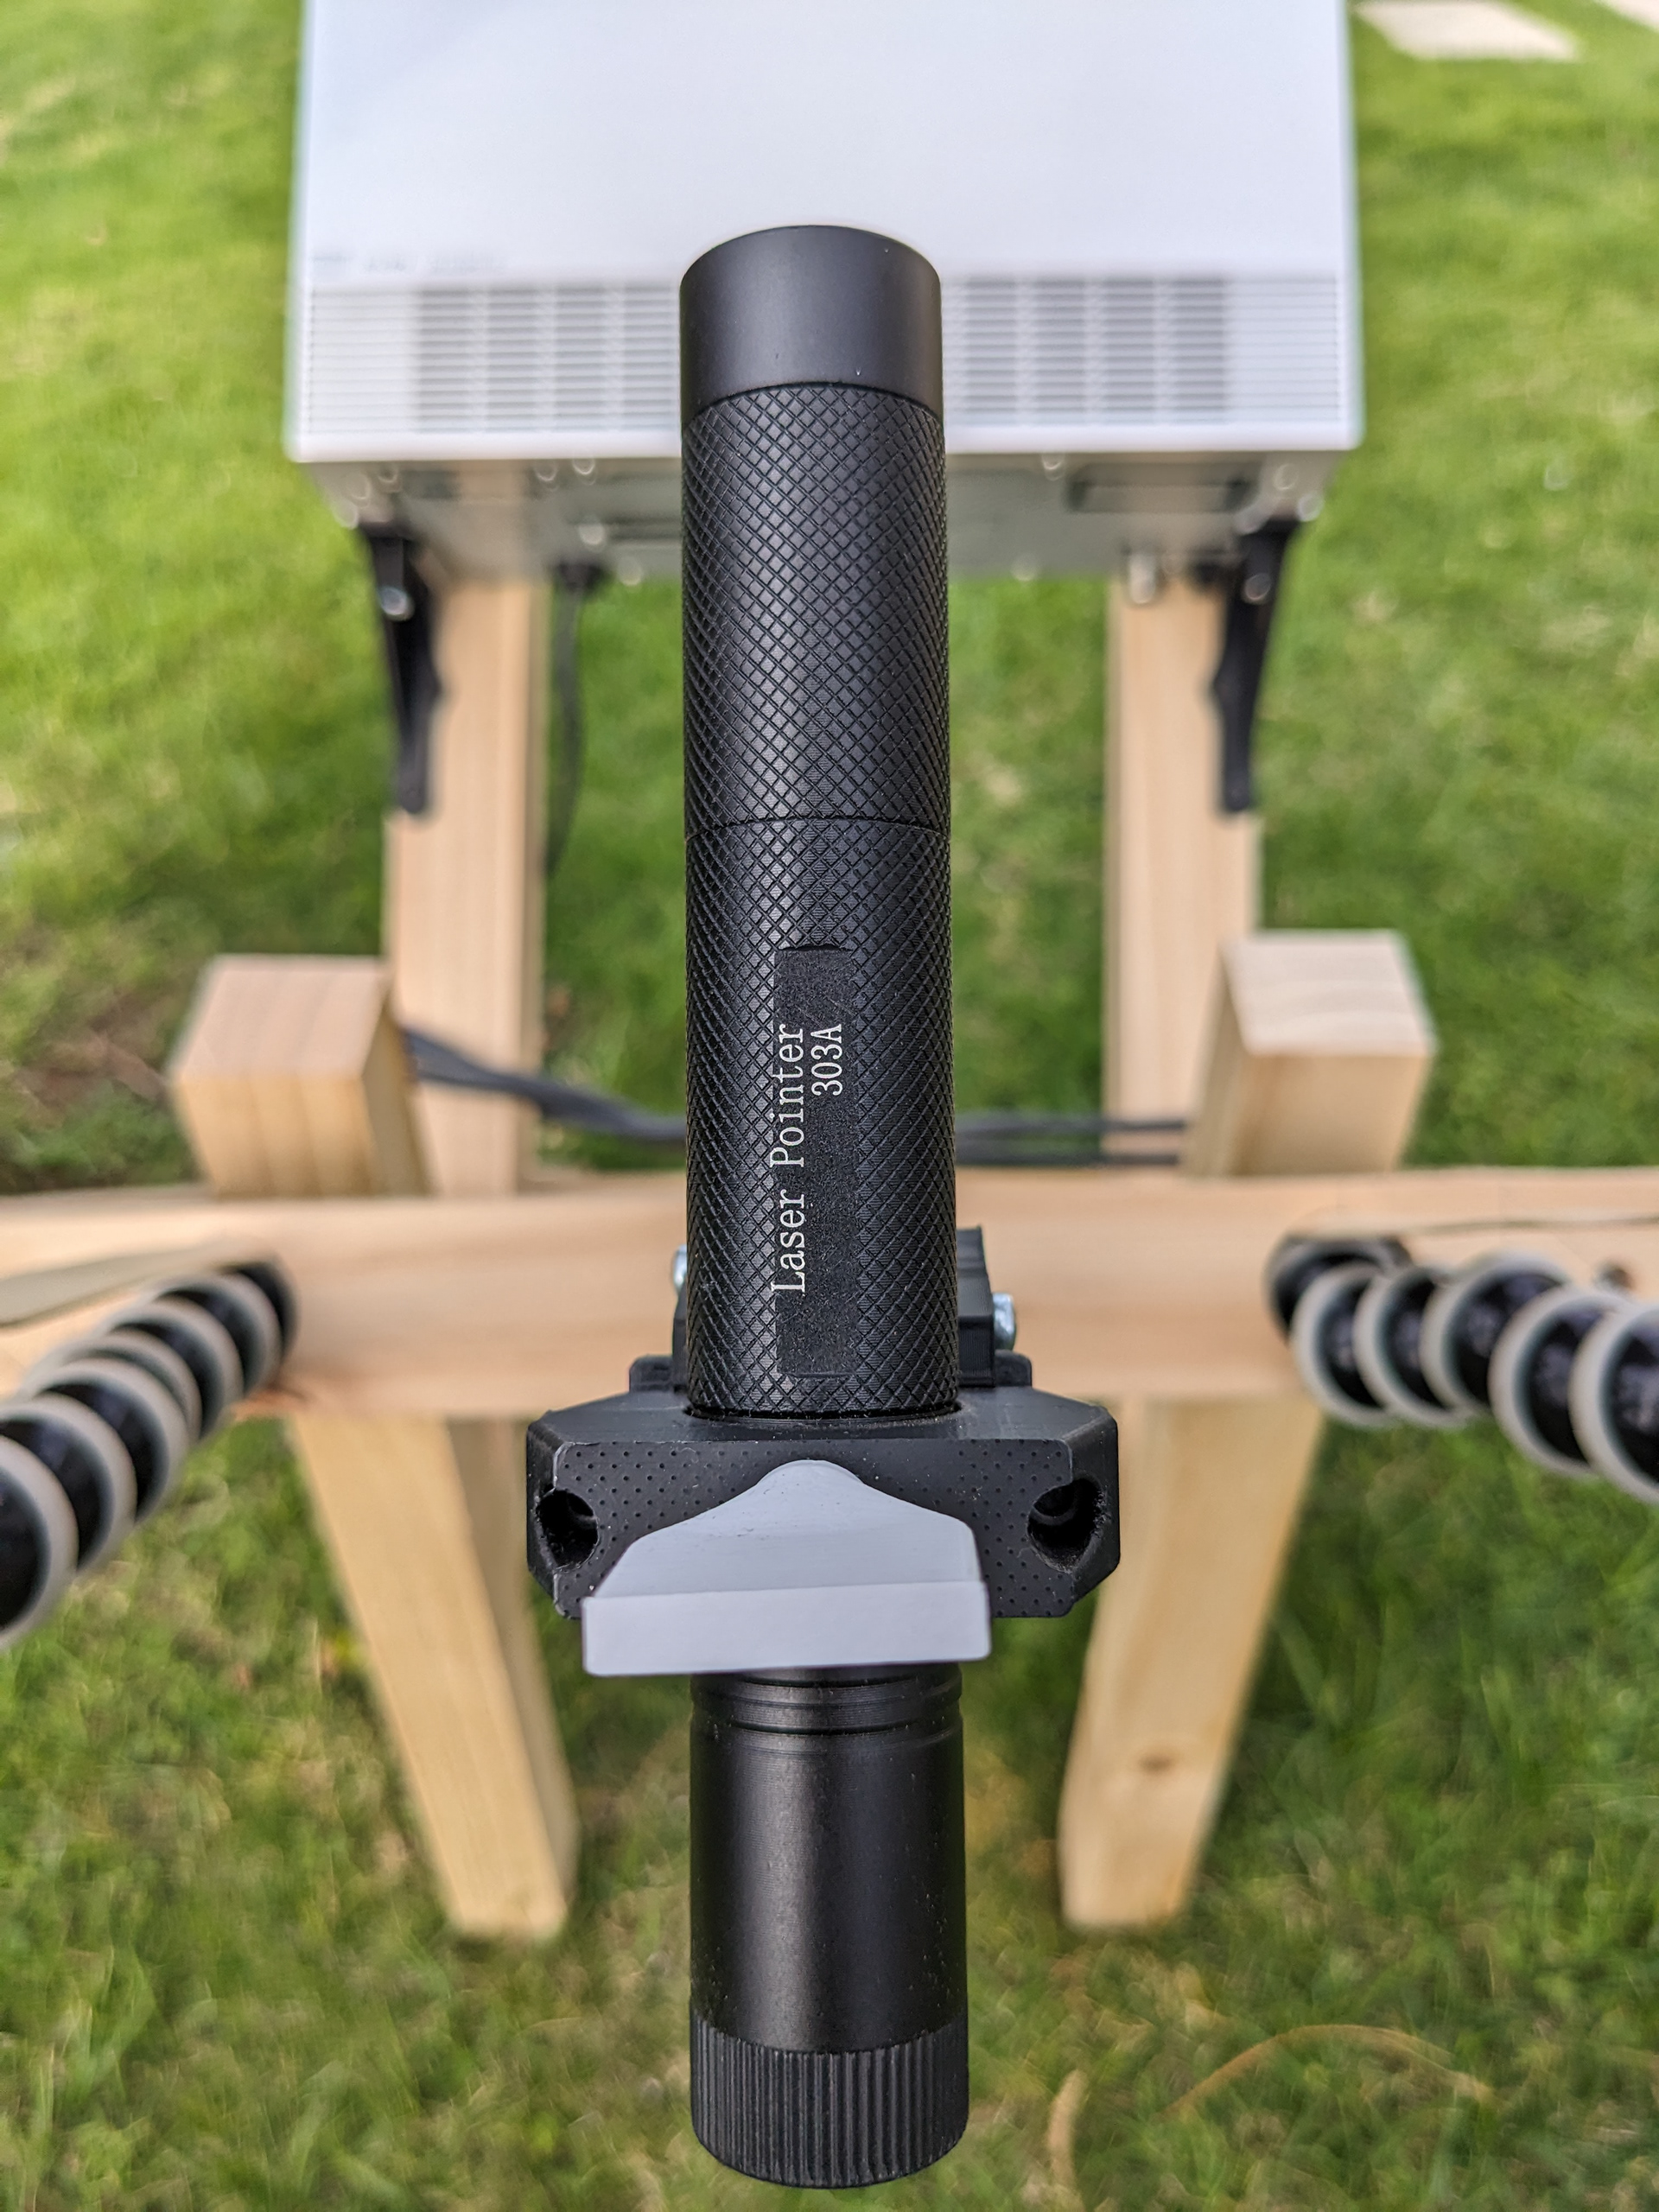
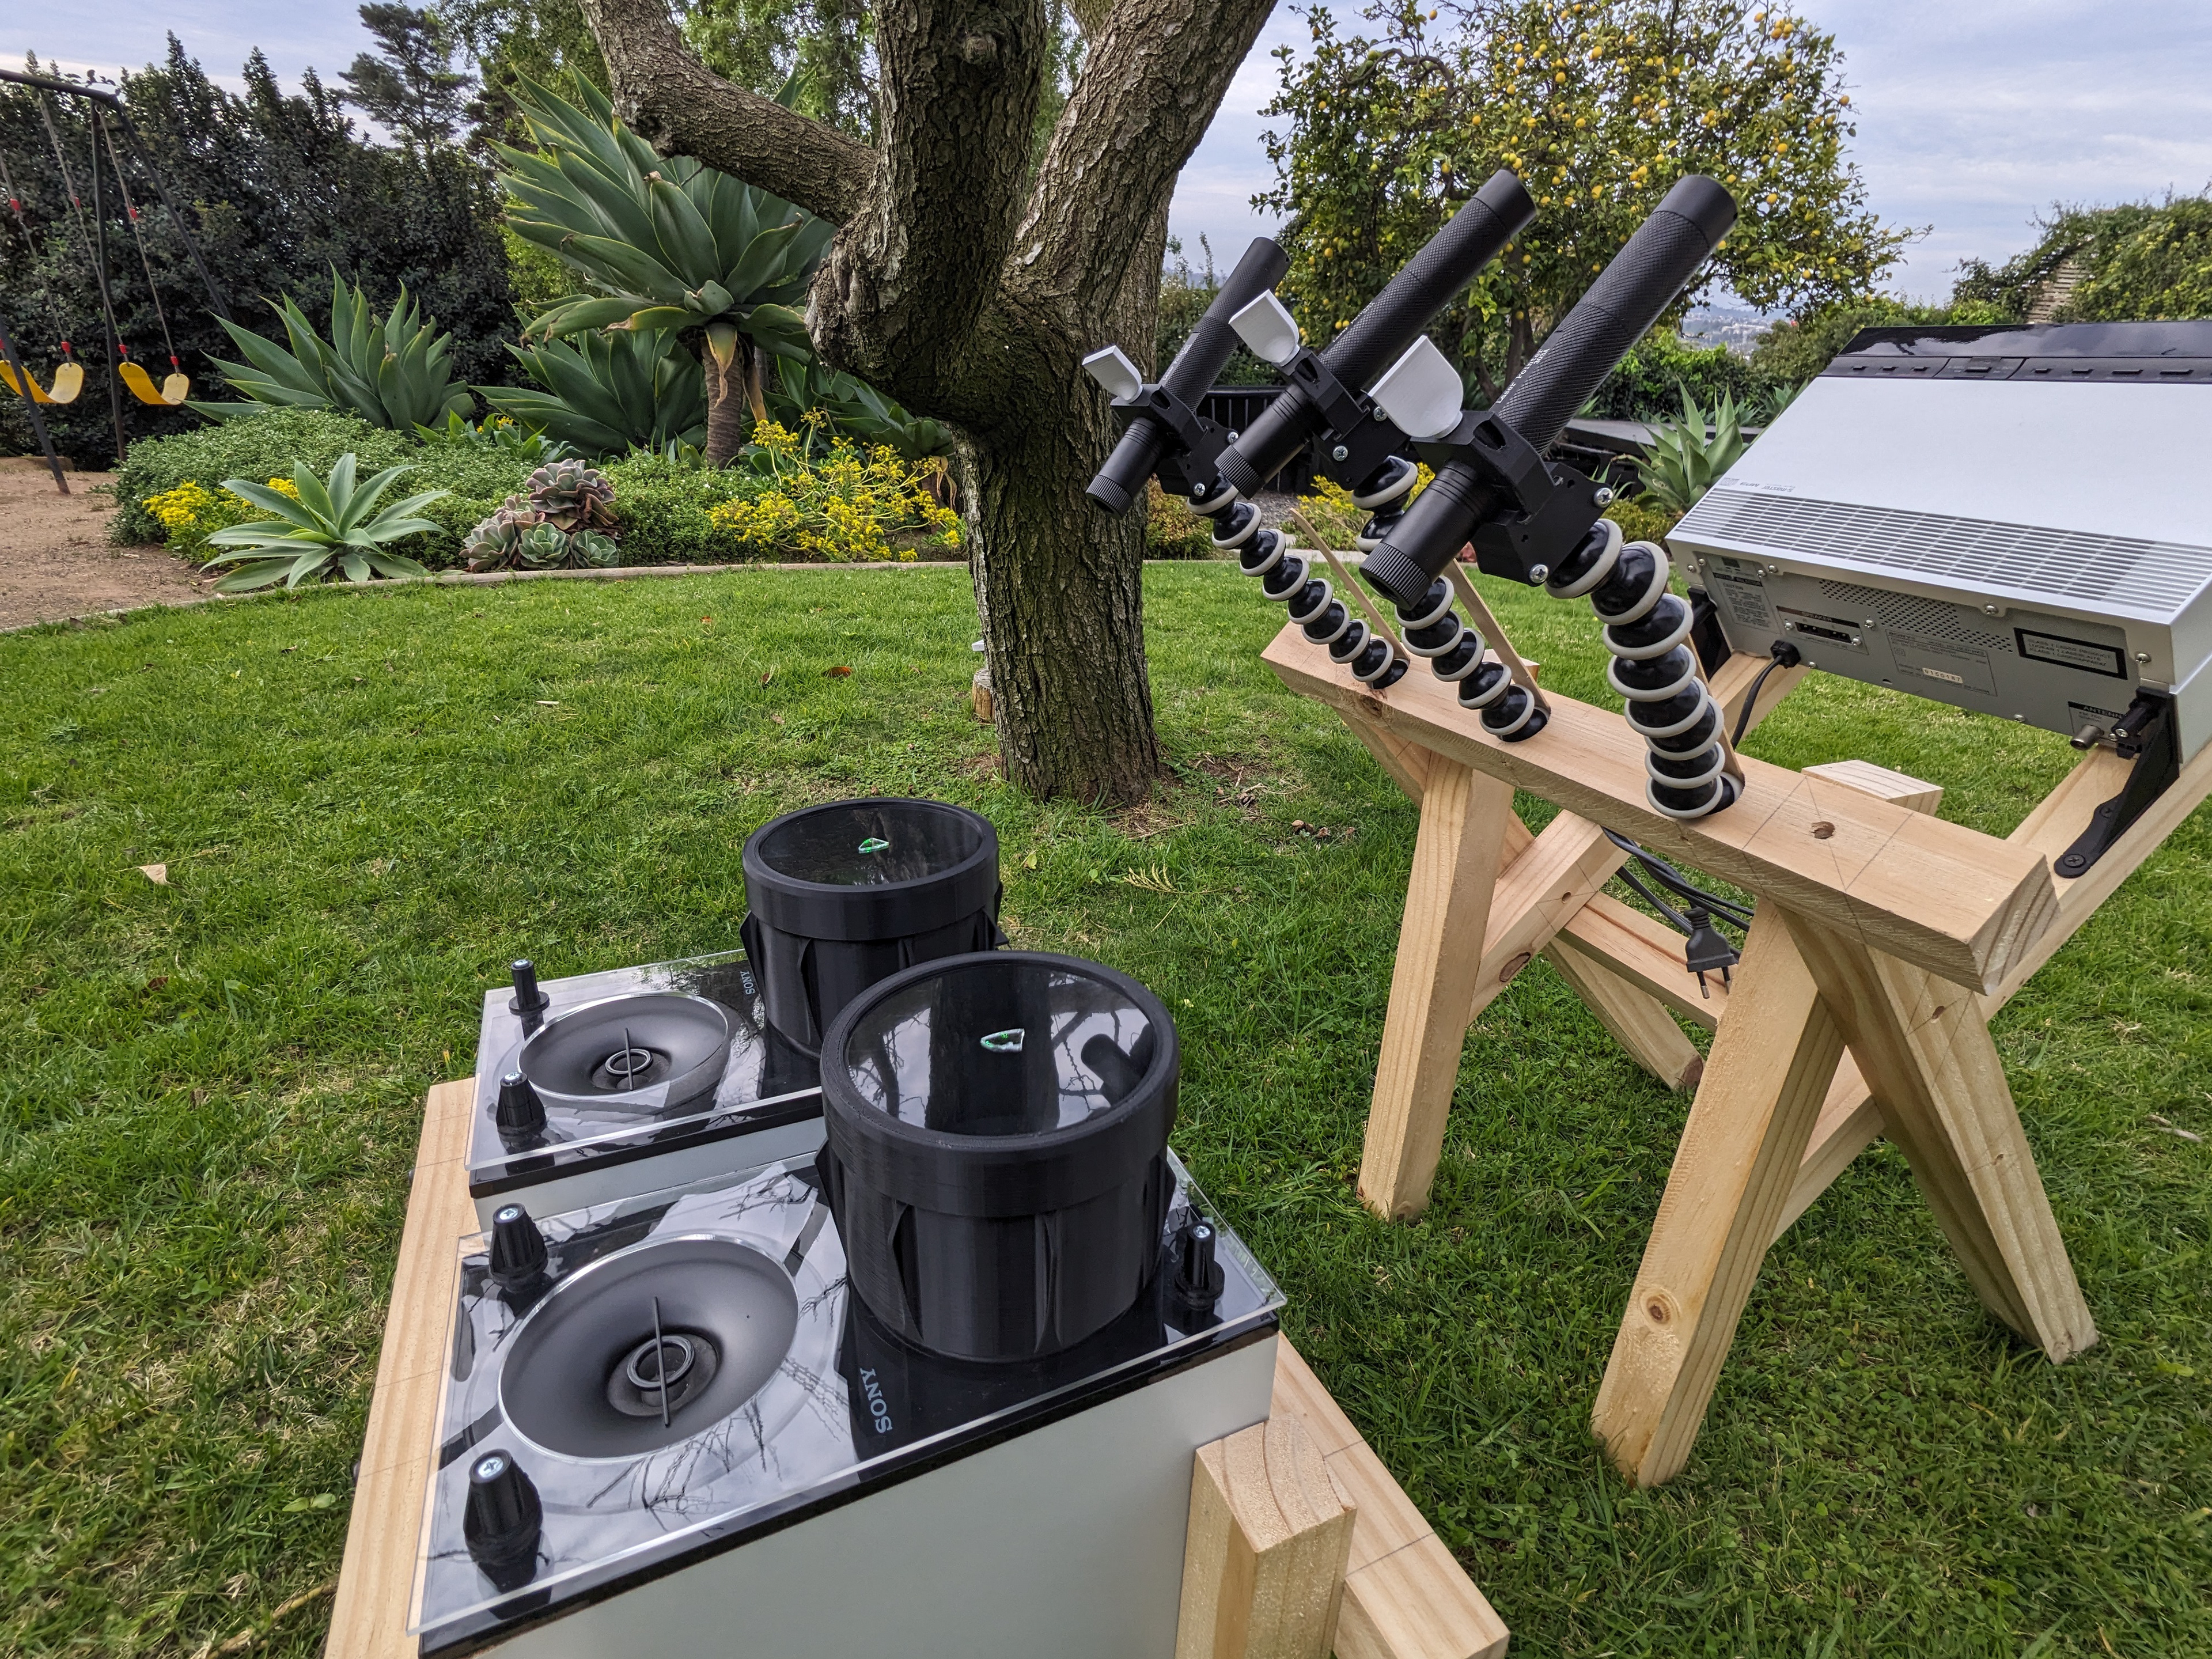
A speaker system was intervened to support the membrane and mirror system while 3 off the shelf laser pointers were adapted and a switch was added to properly control the direction and stability of the light source.
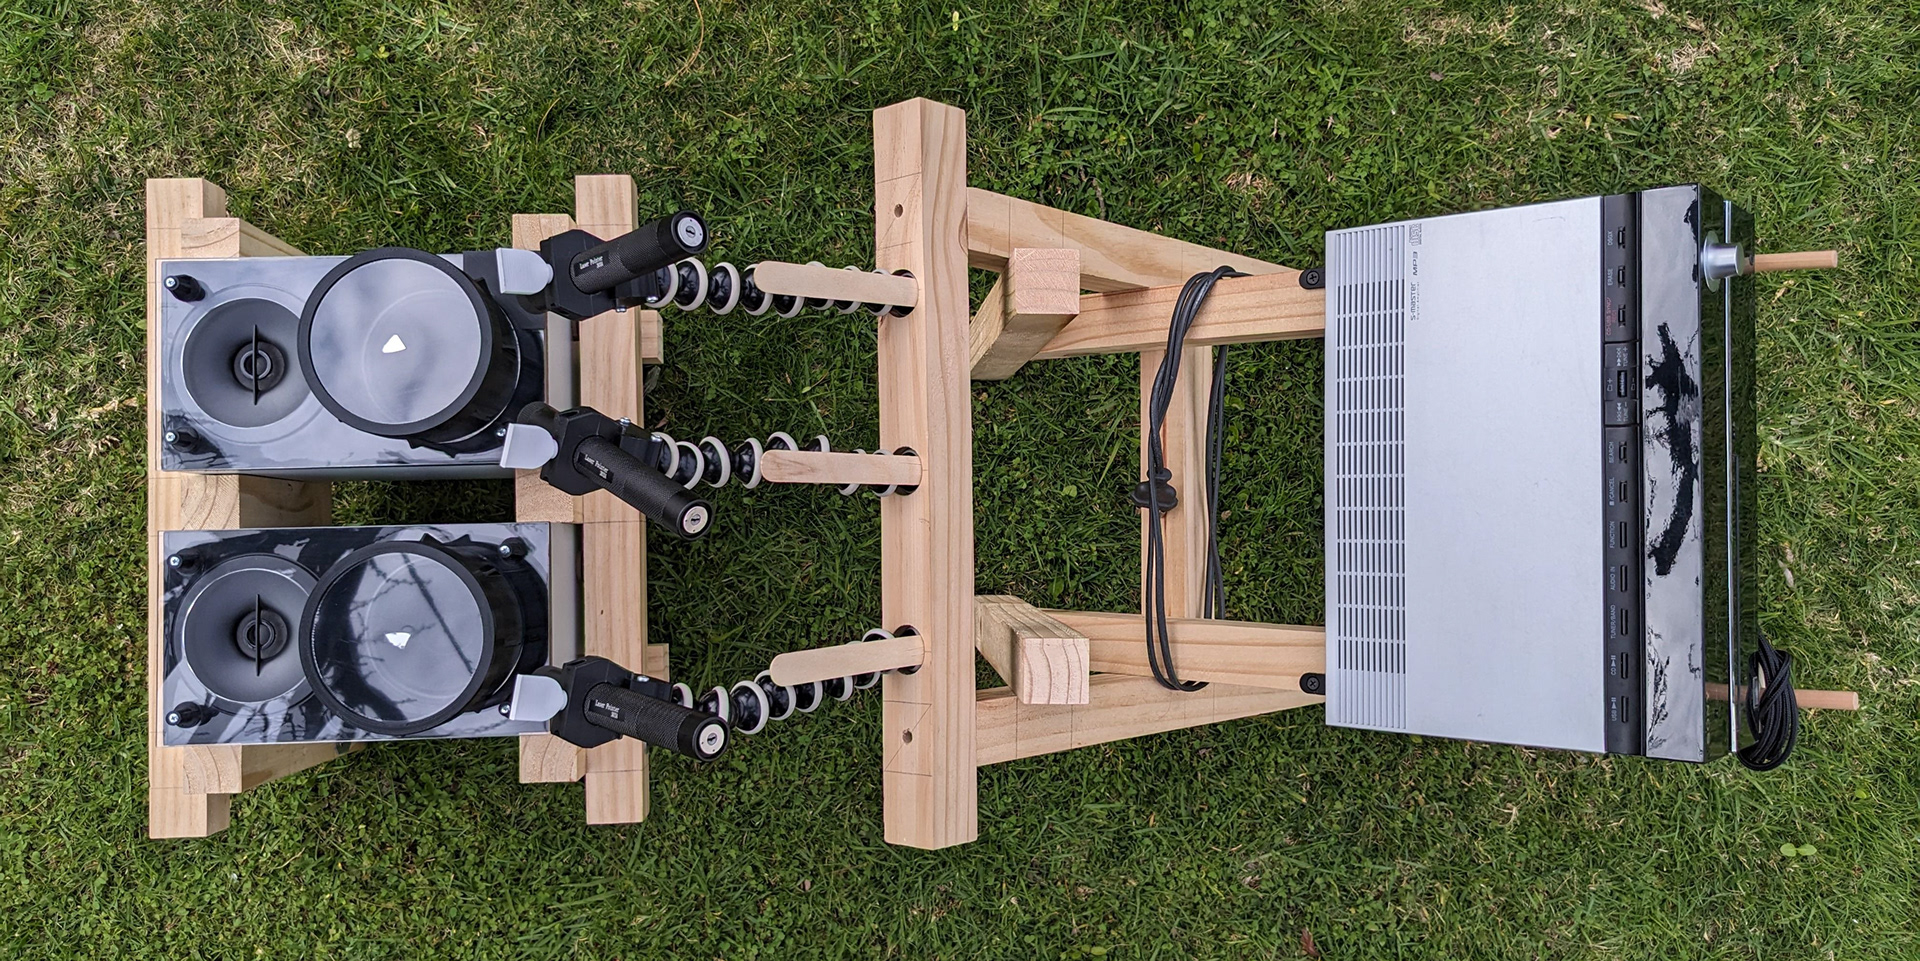
The two units connect to a computer or phone that allows music to be reproduced and visualized through the 3 distinct laser units that bounce off the mirrors and can be projected onto a surface. As well as music, a single or channeled frequencies can be reproduced to create static or looping figures that resemble an oscilloscope.
It’s interesting to note the rather intuitive nature of the curve shapes as they manifest in ways that are familiar to the sound signature within a completely analogue system.
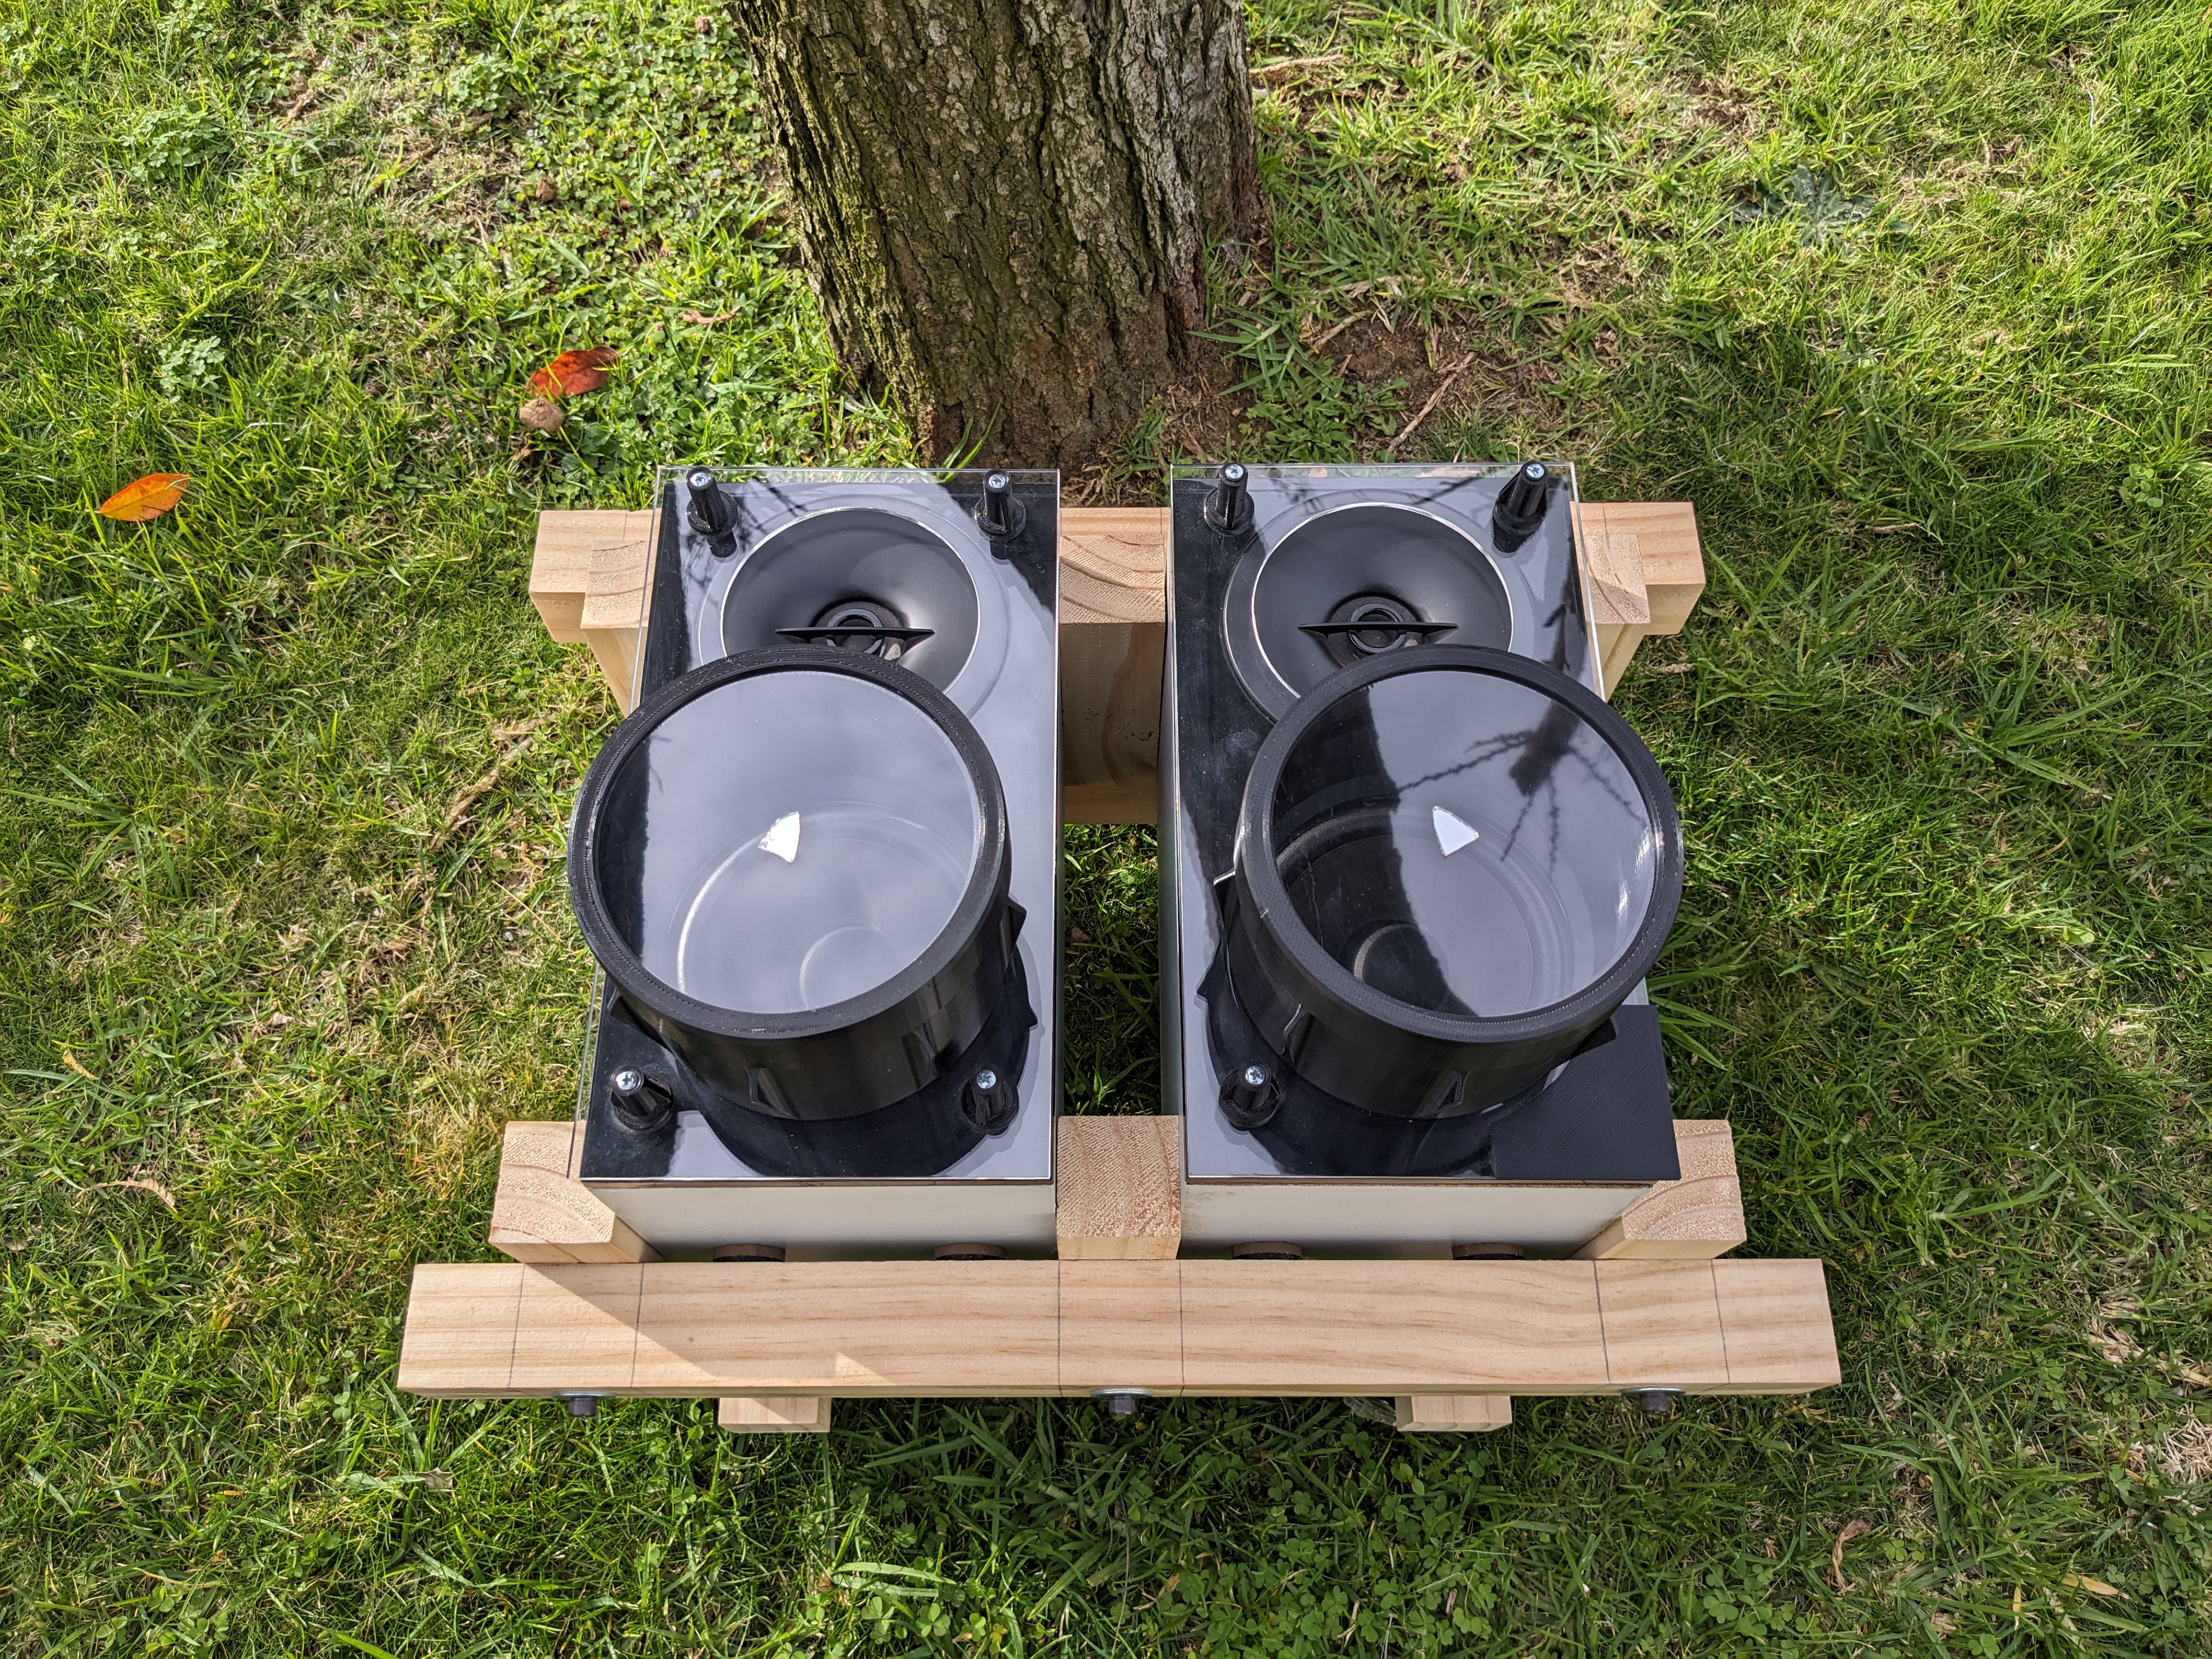
Speaker platform, holds both speakers and their respective membrane and mirror.
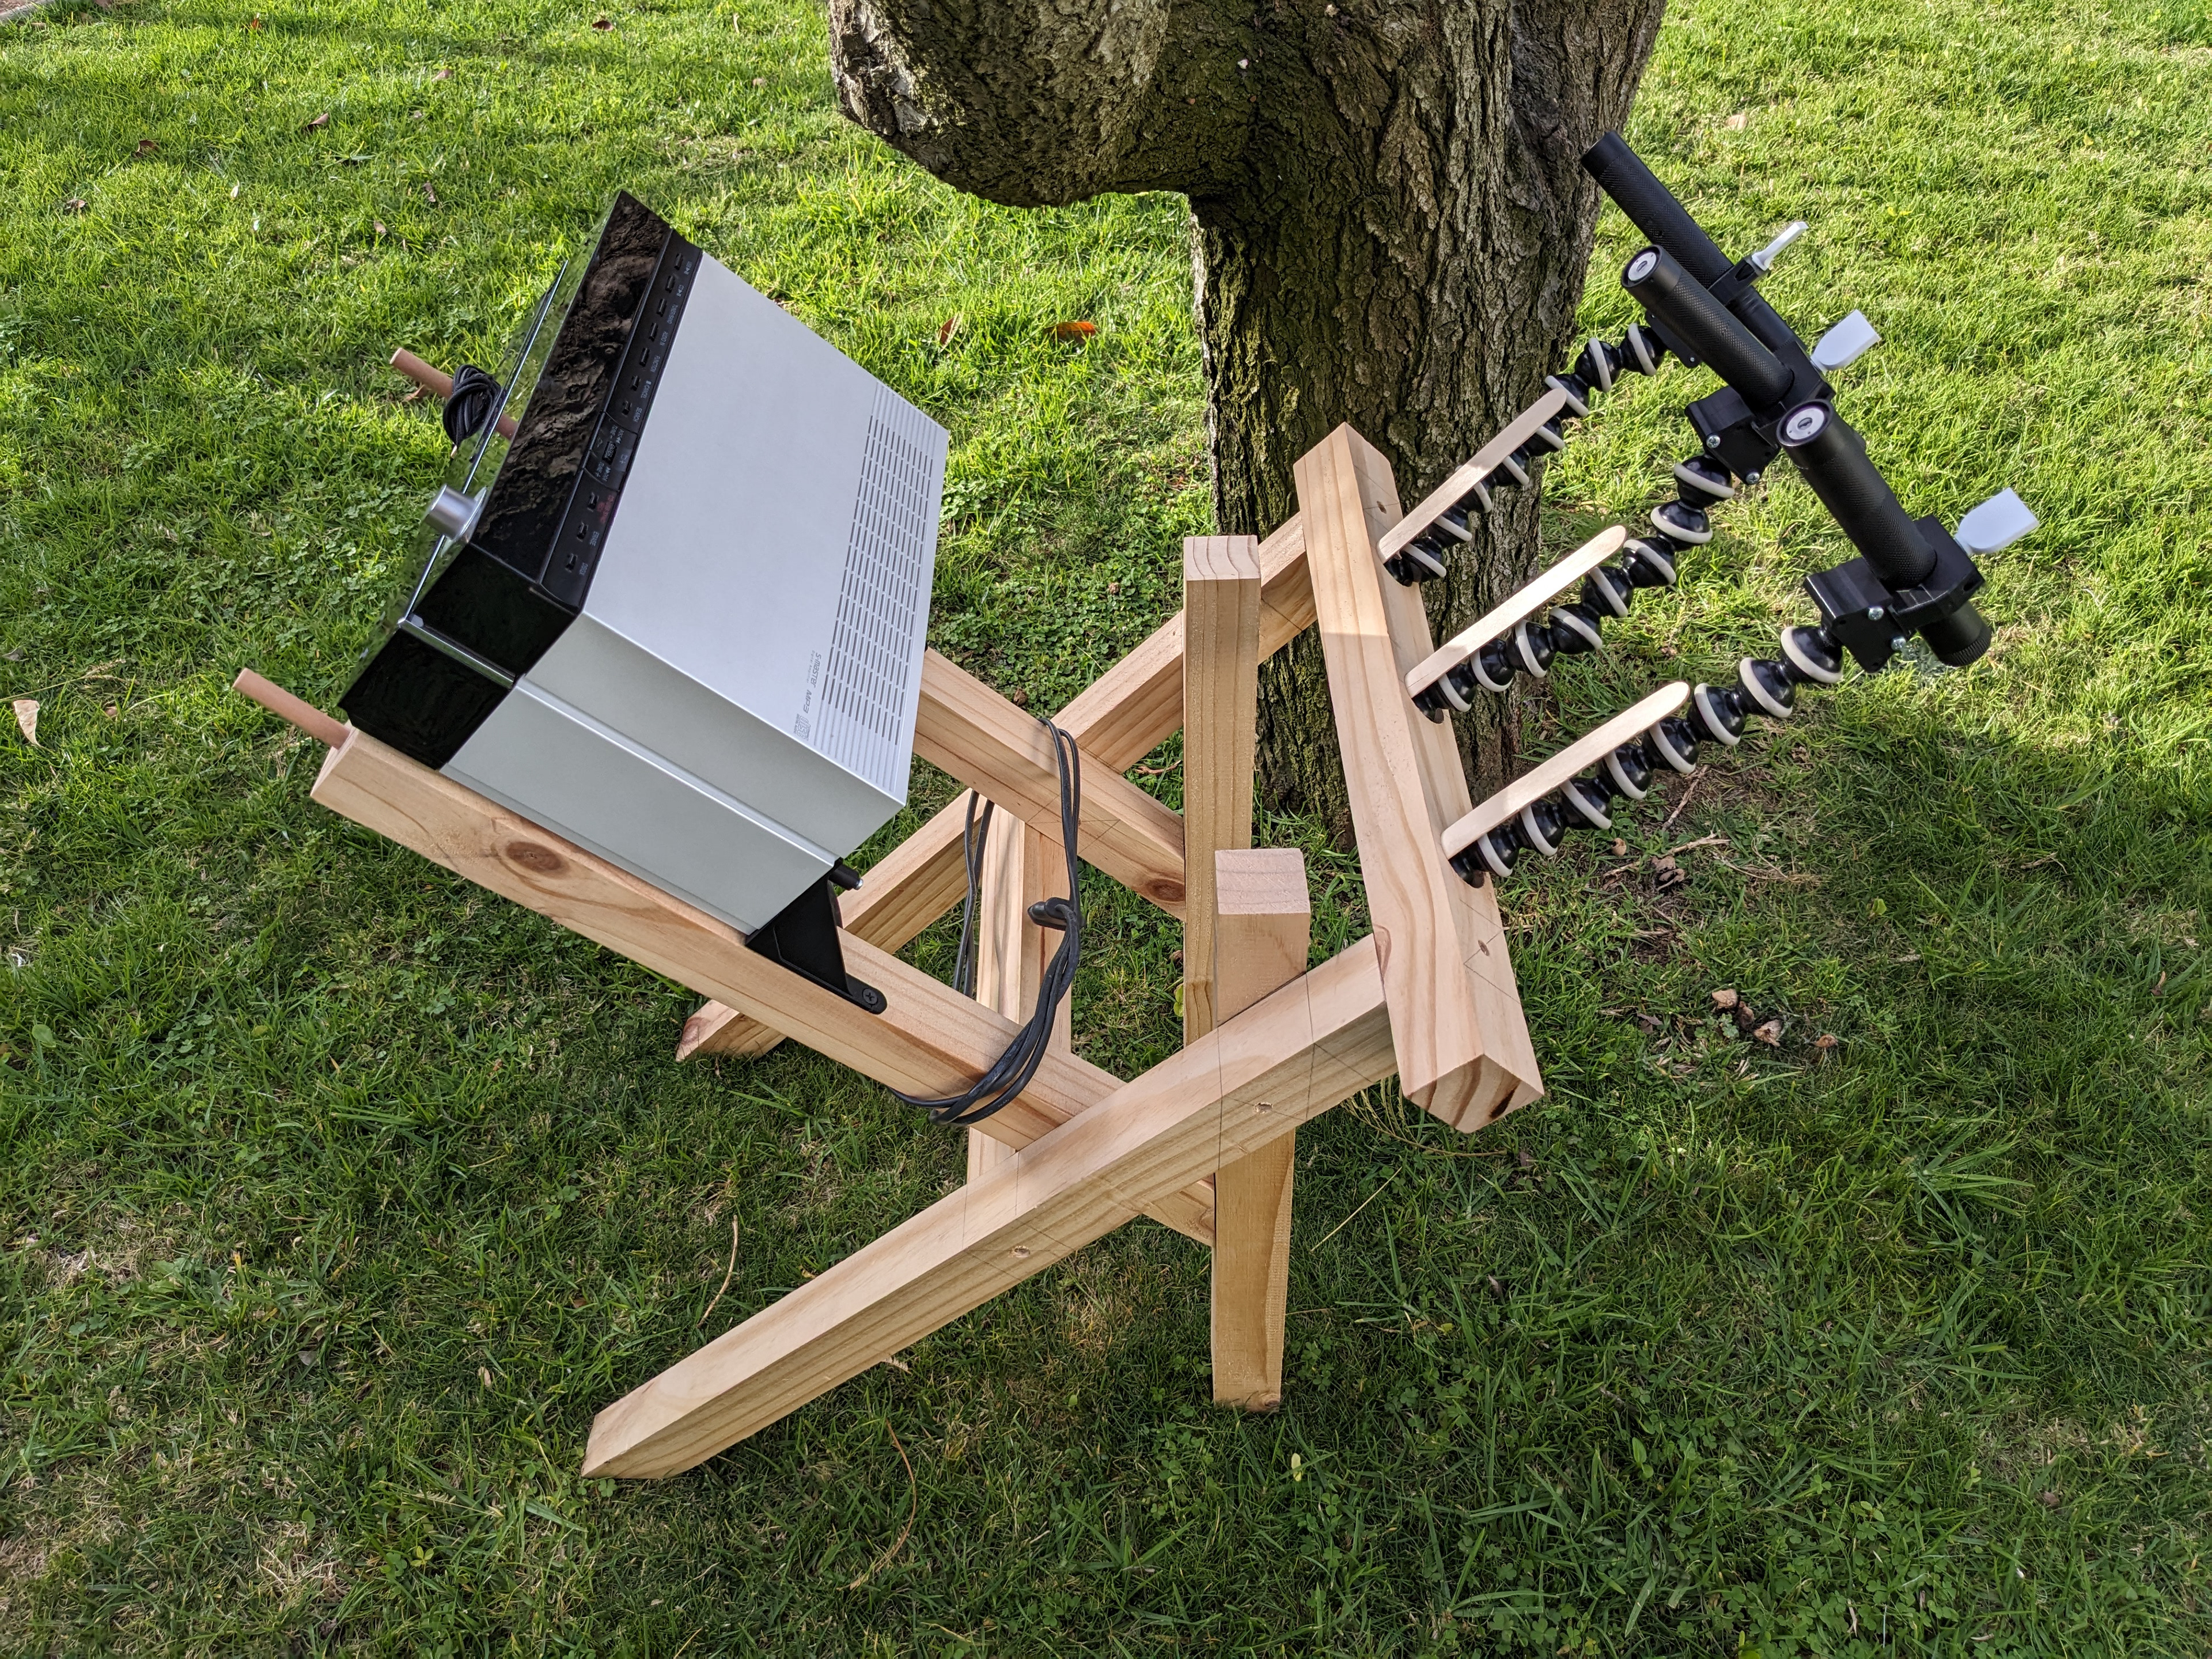
Laser platform, holds 3 adapter laser pointers and amplifier.
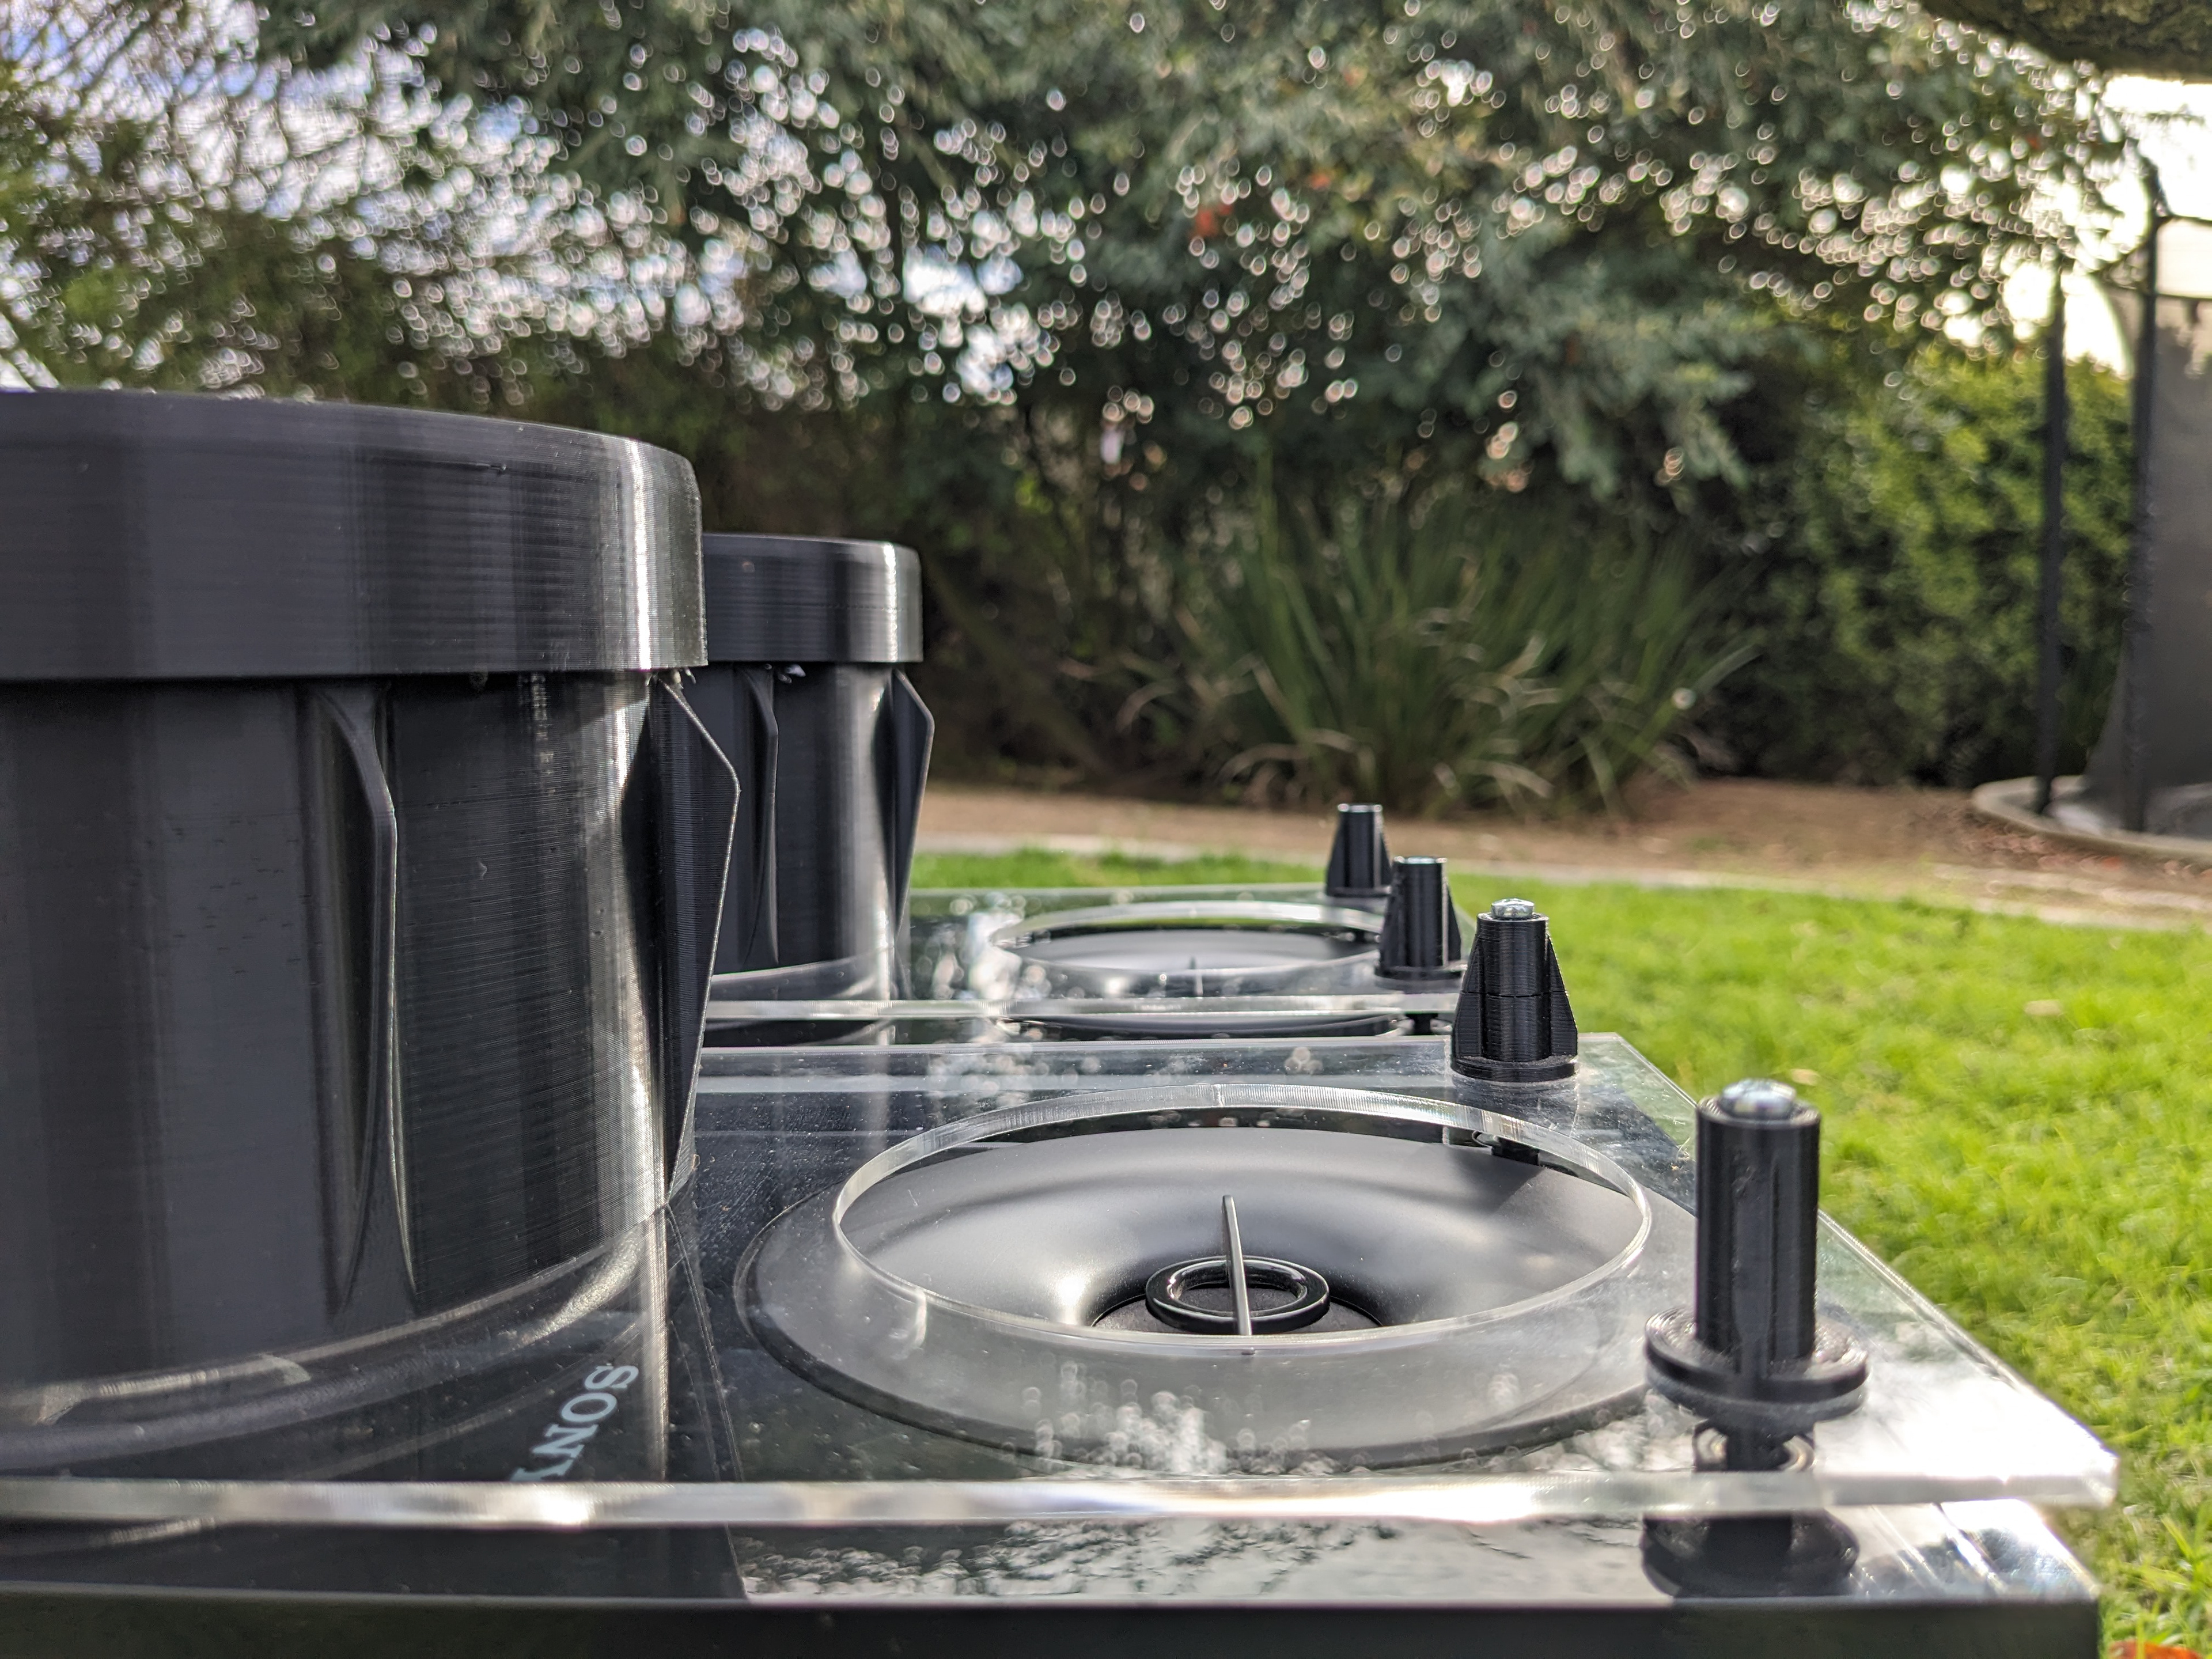
Custom fitting system to reduce unwanted vibrations.
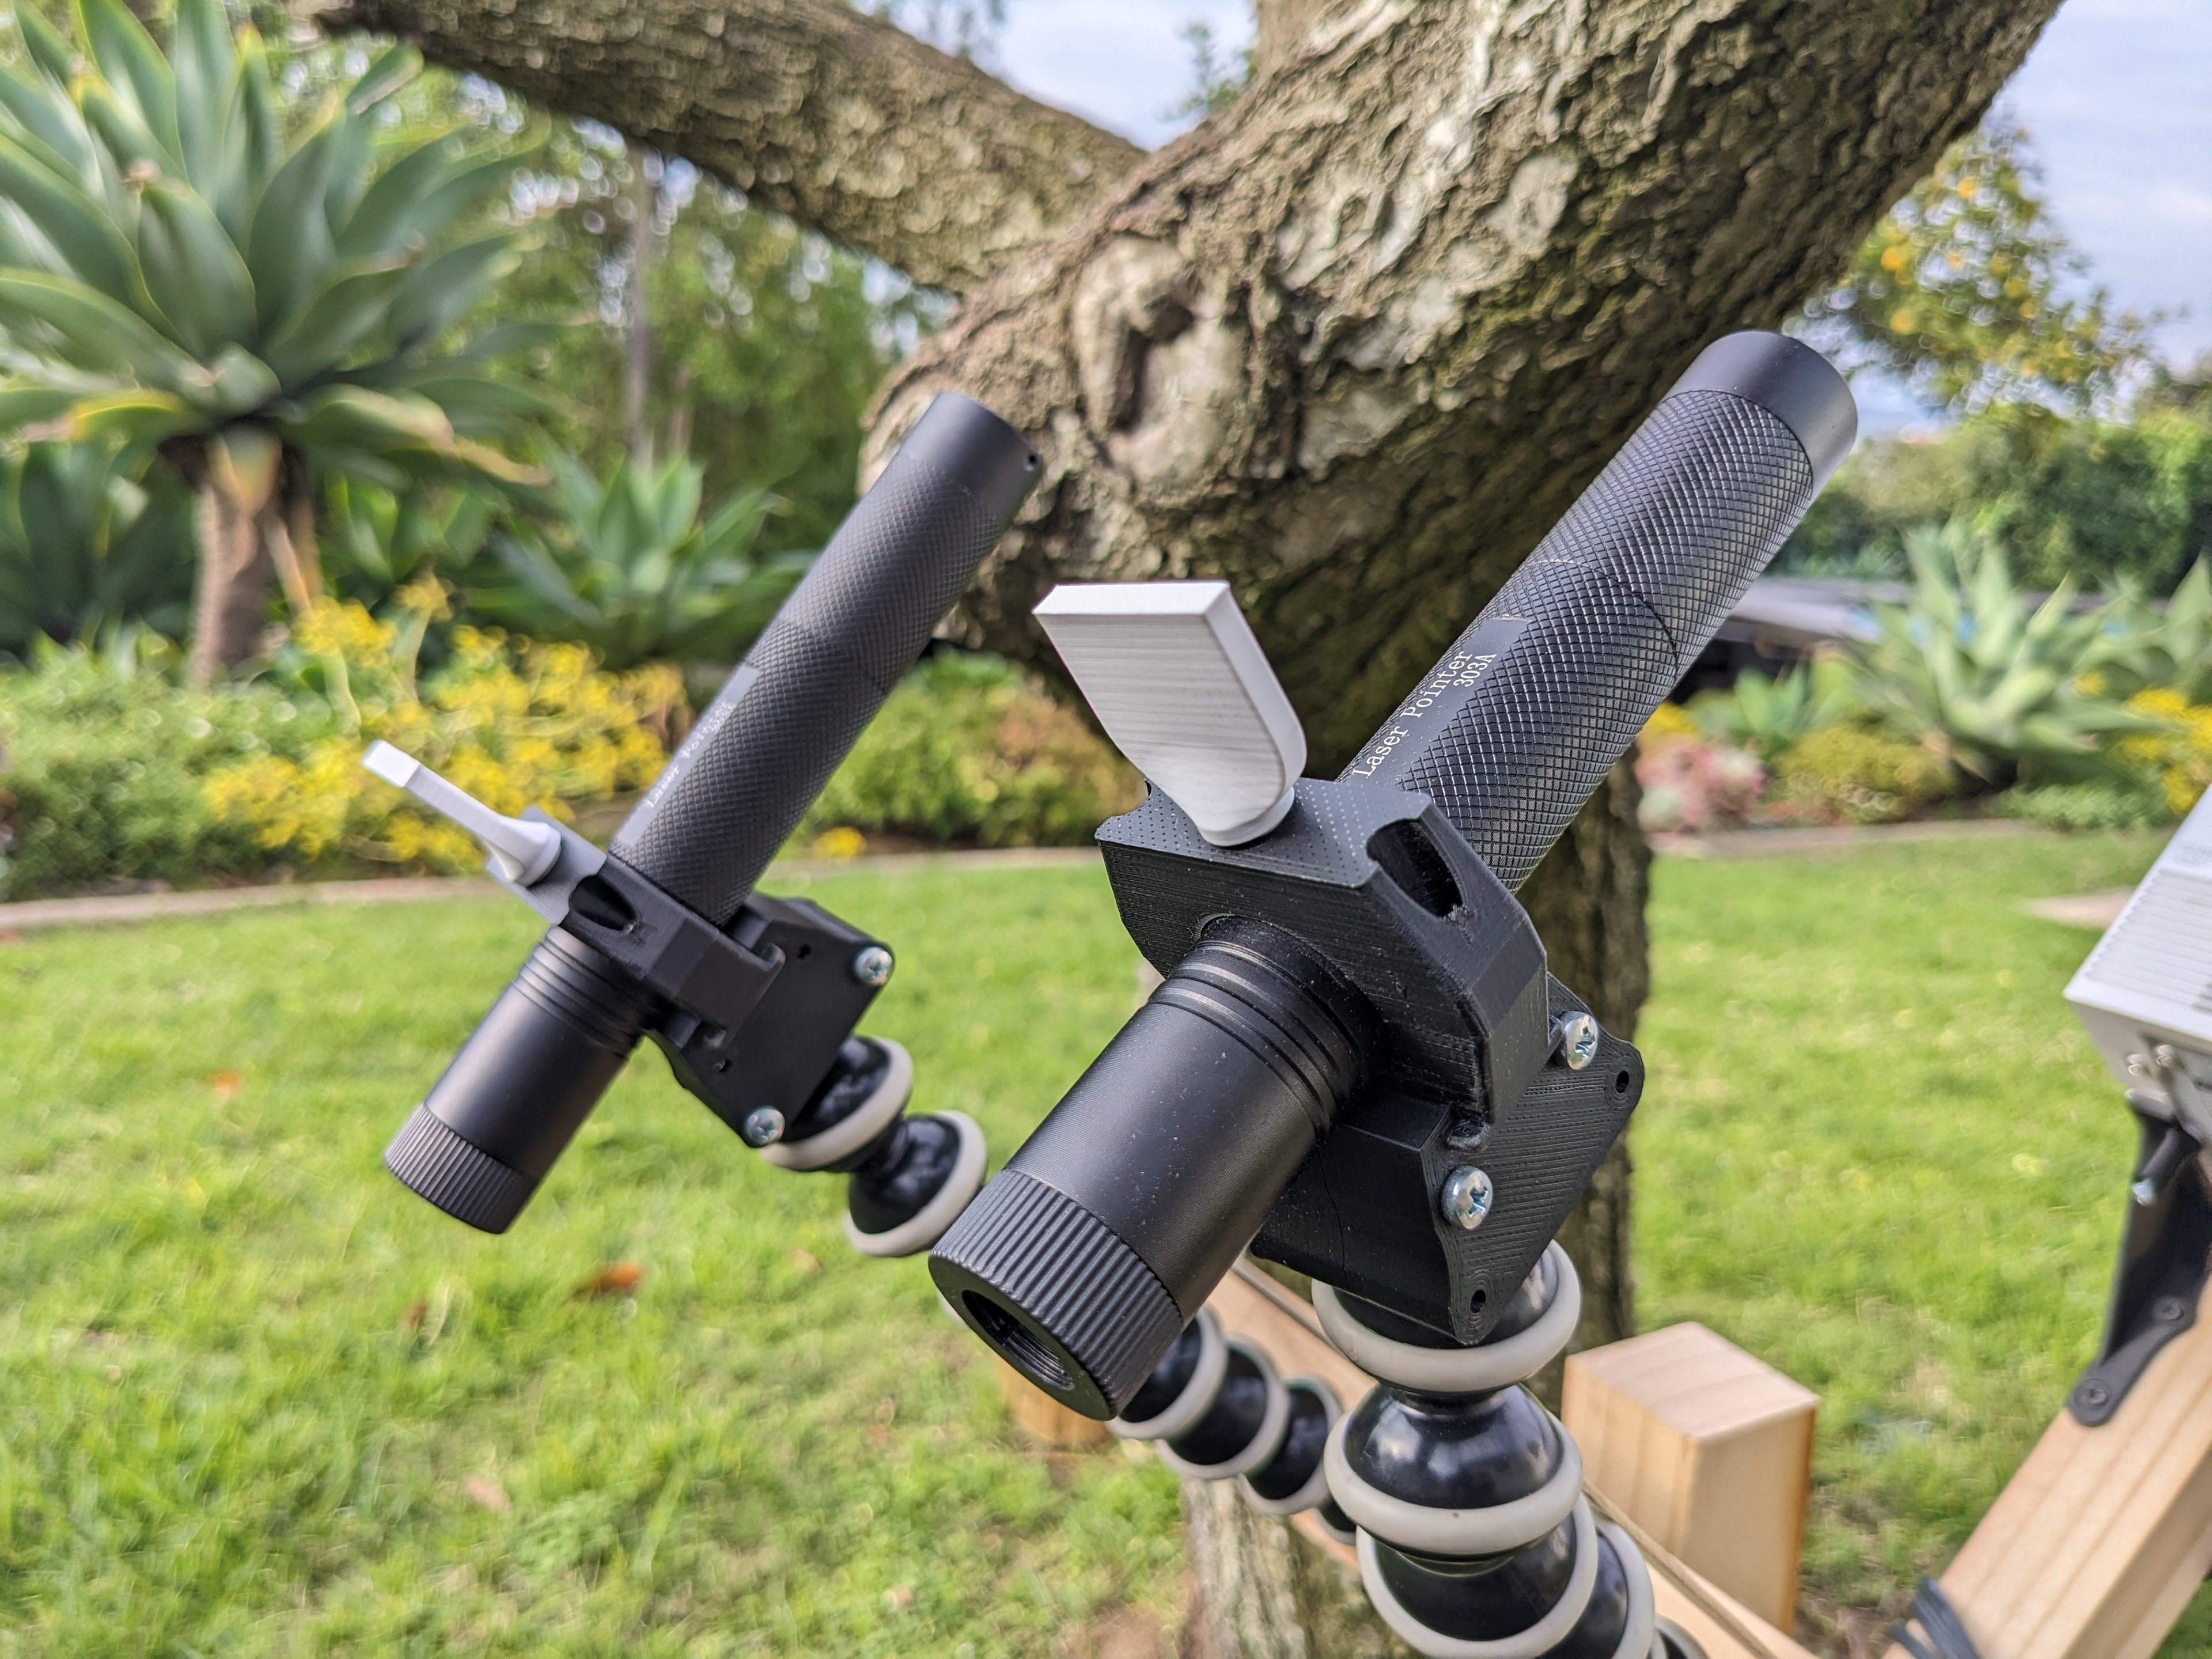
Custom coupling and switch system.